Favorites
Customize ESPN
ESPN Sites


ESPN Apps


Winners, losers and head-scratching picks: Kiper wraps Rounds 2 and 3
Which NFL teams fared well in the second and third rounds of the draft, and which reached for picks? Mel Kiper Jr. makes sense of Day 2.
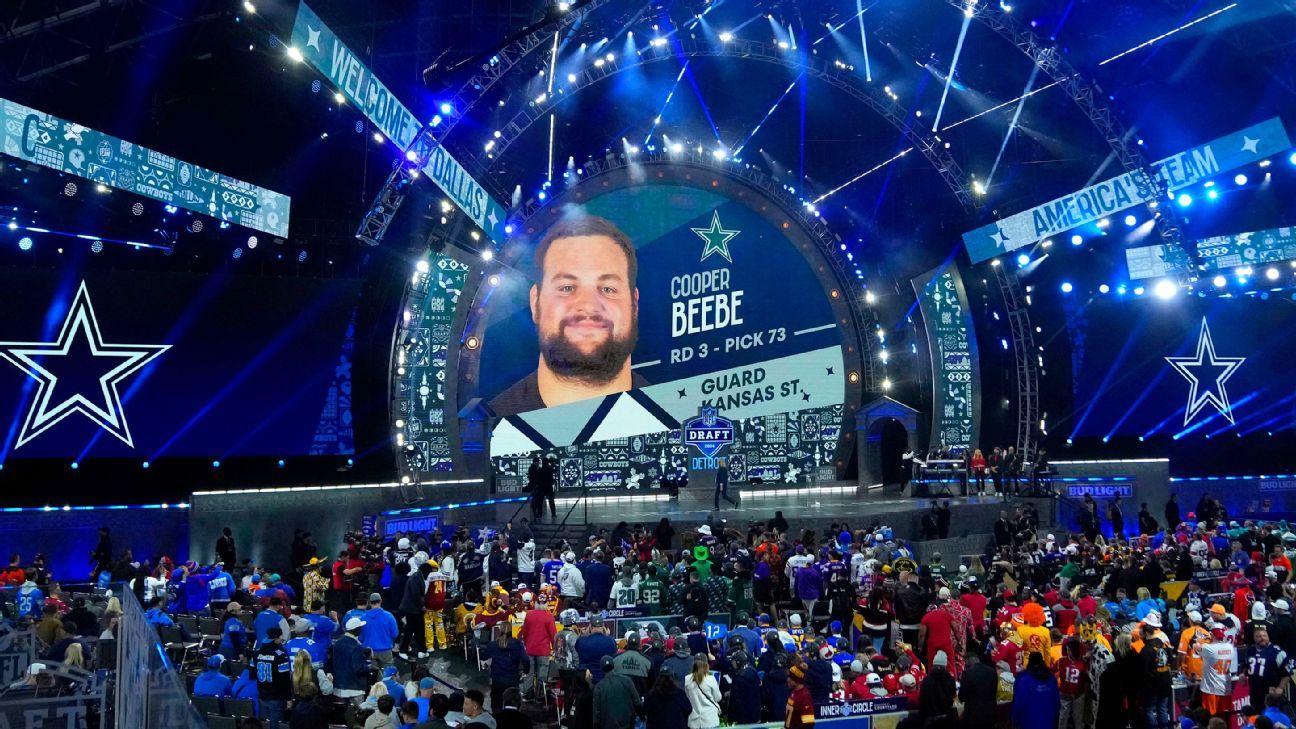
Analysis of every pick in Rounds 1-3 of the NFL draft
Get insights on all 32 teams' draft picks and trades from our NFL Nation reporters.

TOP HEADLINES
Tyrese Haliburton knocks down winning and-1 for Pacers in OT
Haliburton on game-winning shot: 'Give me the ball, let's win the game'

Khris Middleton hits another tying 3-pointer for Bucks in OT

Pascal Siakam narrowly misses winning 3 for Pacers at the buzzer

Khris Middleton drills tying 3 in final seconds

Tyrese Haliburton soars in for a massive put-back jam

Andre Jackson Jr. elevates for a massive block for the Bucks

Caitlin Clark revs the engine in Indy and receives a standing ovation

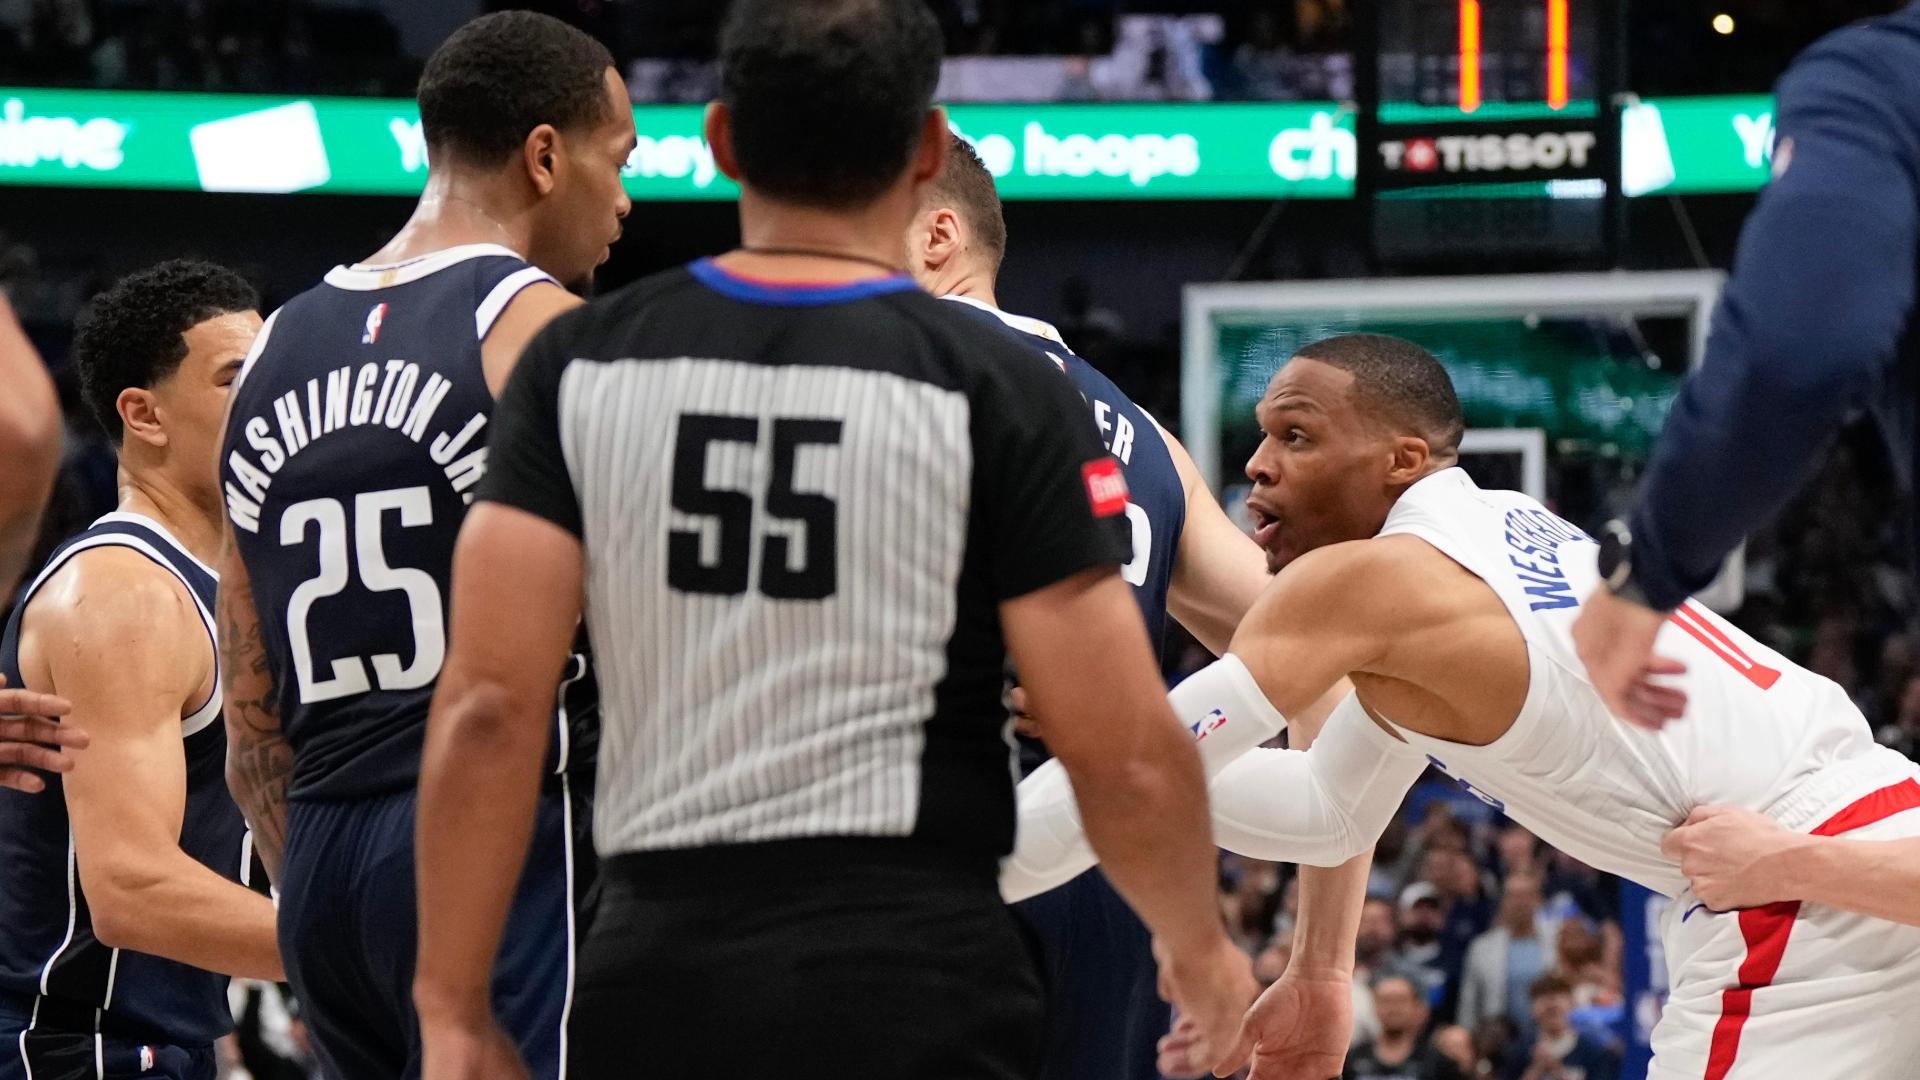
MAVS FRUSTRATE CLIPPERS
TAKE 2-1 SERIES LEAD
Daniel Gafford erases Paul George's poster attempt with massive block

Russell Westbrook and P.J. Washington ejected after scuffle
NBA PLAYOFFS
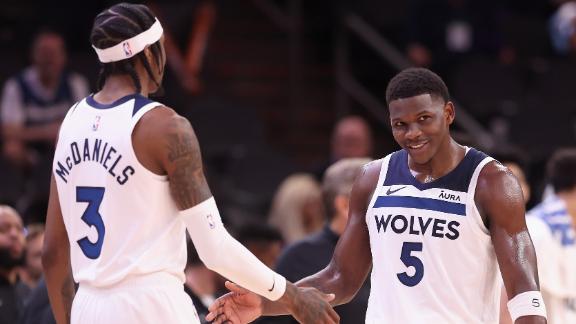
Timberwolves take 3-0 series lead after blowout win vs. Suns

HOCKEY POSTSEASON CONTINUES
Stanley Cup Playoffs Central: Bracket, schedule, game previews for the NHL's postseason
From the first round all the way through the Stanley Cup Final, ESPN has you covered. Explore the full results, and coverage on each team.
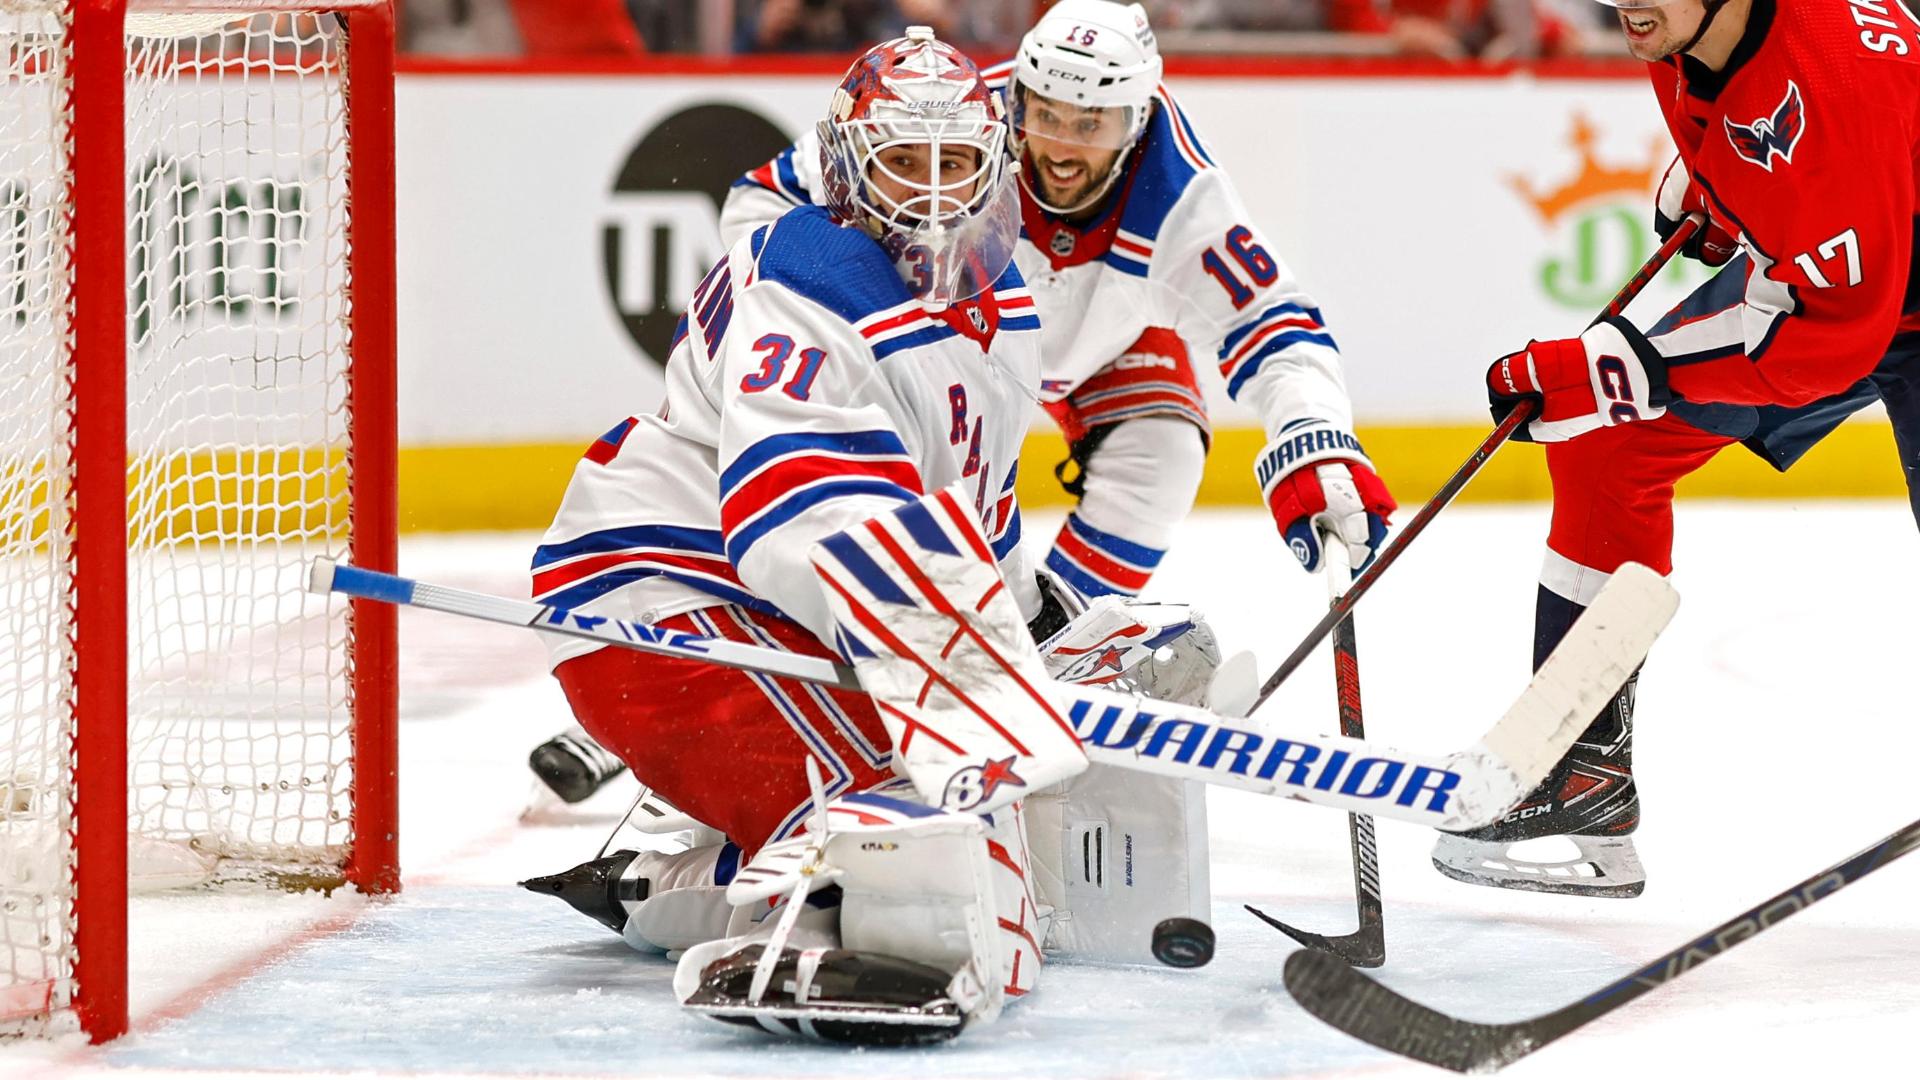
BEST FROM THE ICE
STANLEY CUP PLAYOFFS
Connor McDavid's power-play goal pads Oilers' lead

Igor Shesterkin makes a sprawling save, part of a lights out performance
AROUND THE DIAMOND
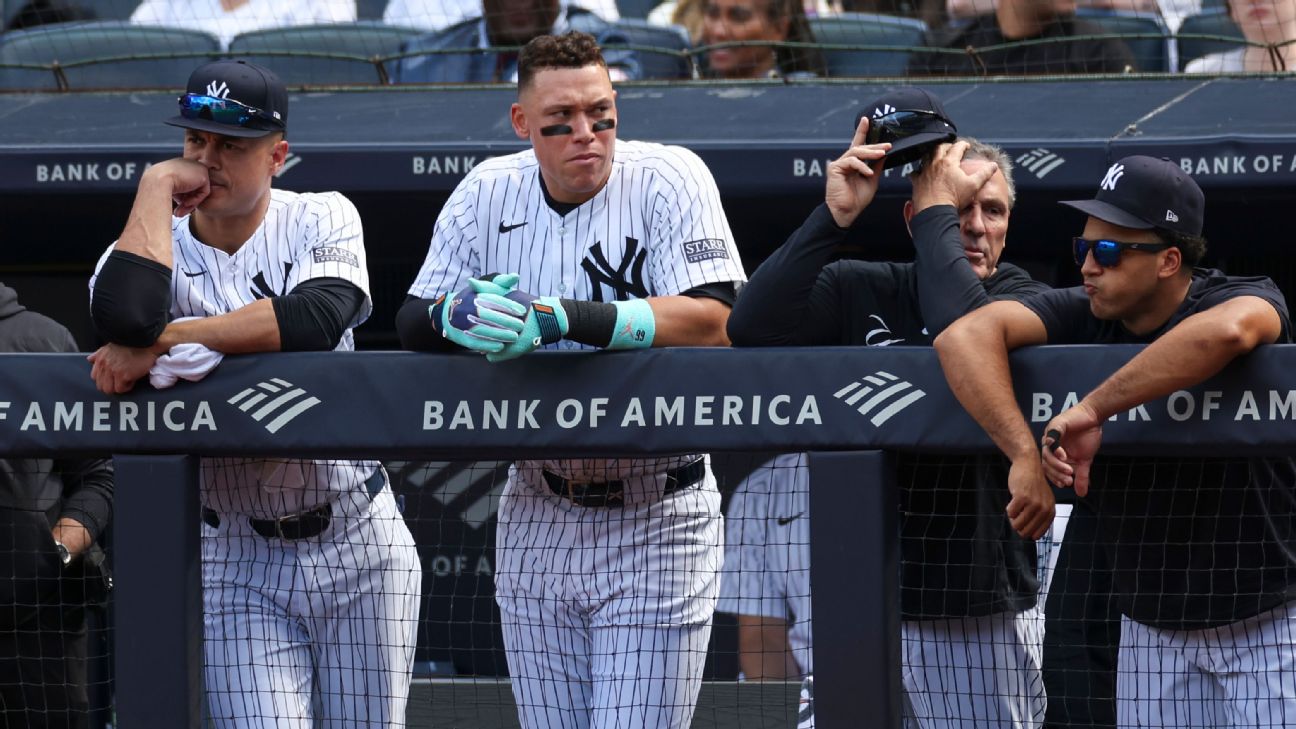
'I'm still Aaron Judge': Why the Yankees' captain believes he can turn it around
The Yankees offense depends on Judge's bat. Can he turn it up in time for two of their biggest series of the spring?
Power Rankings: Where every team stands one month into the season?
One red-hot team is inching closer to a top-five debut this week, while an AL power continues to slip down our list.

MLB SCOREBOARD
FRIDAY'S GAMES
WALK-OFF FRIDAY
BEST FROM THE DIAMOND
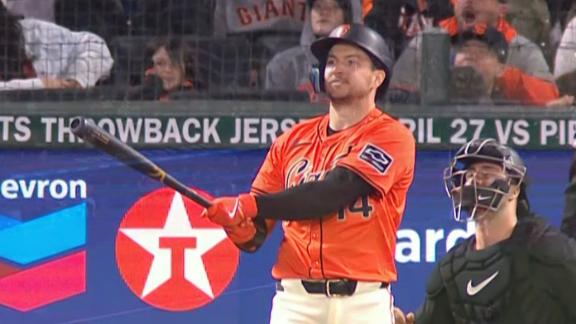
Patrick Bailey walks it off for Giants with a 3-run HR
Mitch Haniger smacks grand slam to extend the Mariners' lead

Top Headlines
- Westbrook, Washington ejected in chippy Game 3
- Colts GM defends rookie Mitchell in profane rant
- Ailing Bucks see Lillard aggravate Achilles injury
- KD on fans' boos: Hope it 'ignites' us down 3-0
- Kawhi: Knee 'didn't respond' as hoped; iffy for G4
- Penix: I had 'good conversation' with Cousins
- Cowboys eye Elliott reunion amid RB shortage
- McVay: Stafford wants more guaranteed money
- Grading big NFL draft trades
Customize ESPN
ICYMI
Belichick critical of Drake Maye after Patriots selection
Bill Belichick says Patriots QB Drake Maye needs to improve in order to be an NFL quarterback.

Best of ESPN+
- Eakin Howard/Getty Images
Ranking college football transfers: Best players available in the portal
We're ranking the best players in the portal by past production and potential to contribute to a new team.
- Larry Placido/Icon Sportswire
2024-25 men's NCAA basketball transfer portal tracker: updates
All of the movement in and out of the transfer portal -- including the domino effect of the new deadline for graduate transfers.
- Kevork Djansezian/Getty Images
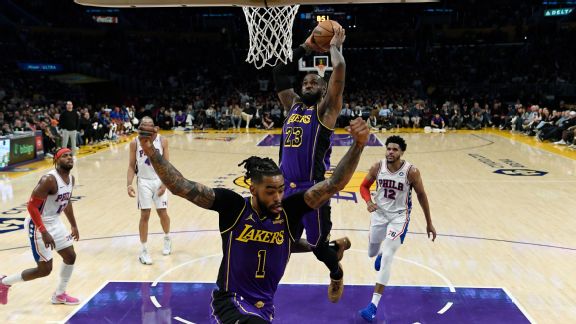
NBA playoffs 2024: LeBron at 9? Here are the top 25 players in the postseason
Kevin Durant at 11? Jalen Brunson at 5?! We rank the 25 best players in this year's playoffs.

Trending Now
- Illustration by ESPN
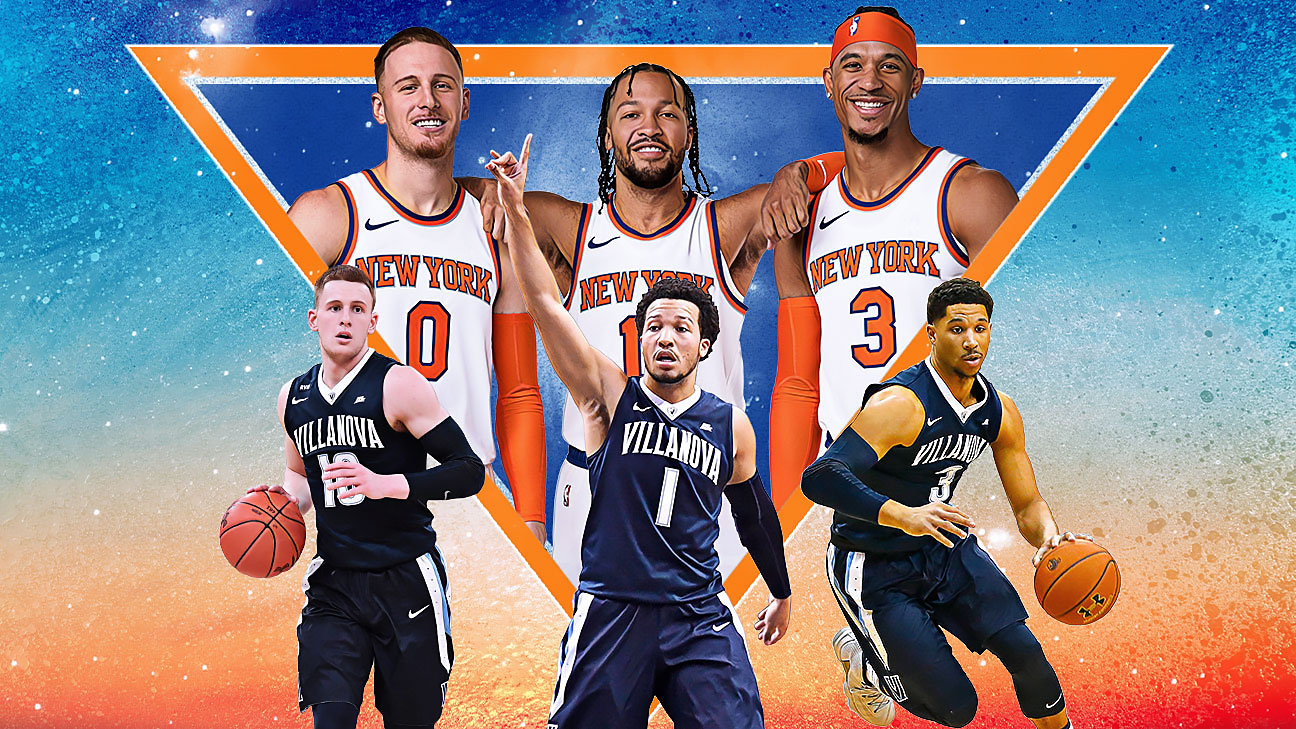
The birth of the Nova Knicks
The "Nova Knicks" date back to 2016, inside a Villanova dorm room, centered around despising one specific teammate.
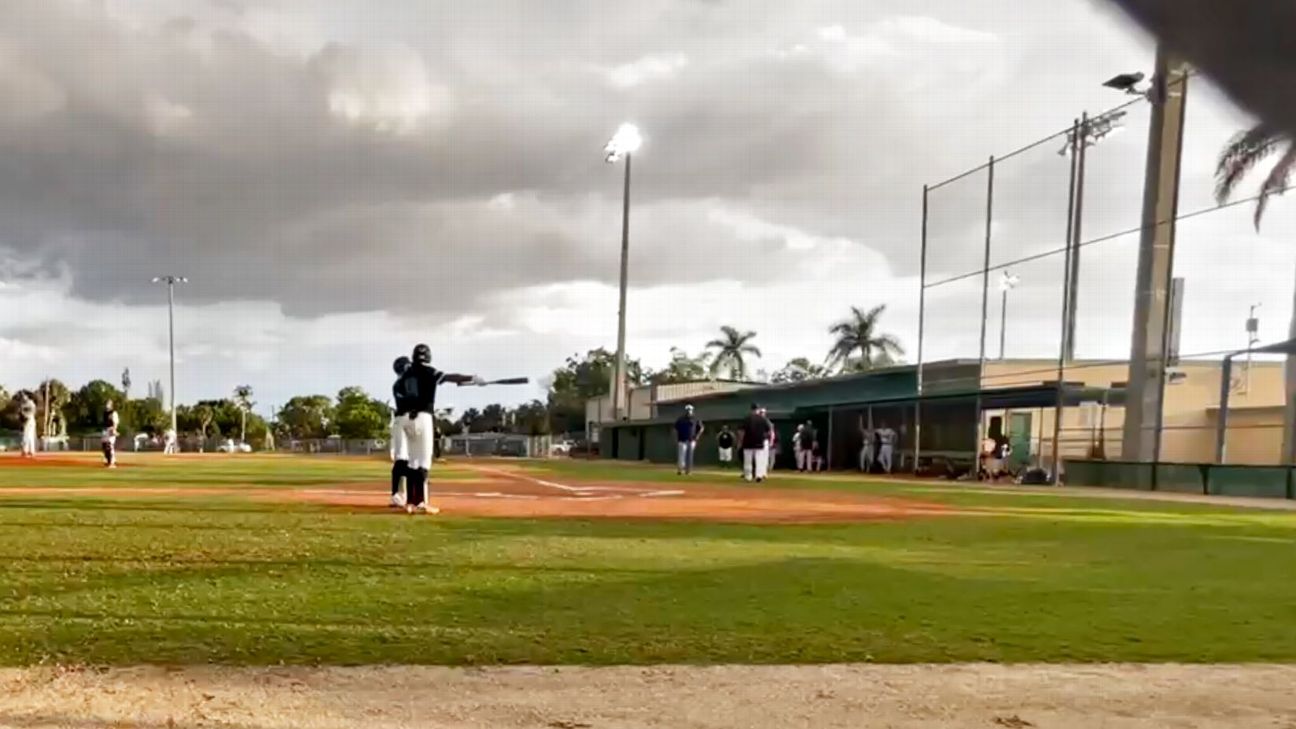
- Video screengrab gathered during walkout
A racial slur and a Fort Myers High baseball team torn apart
Inside the 2023 Fort Myers High School baseball walkout when two teammates were left behind.
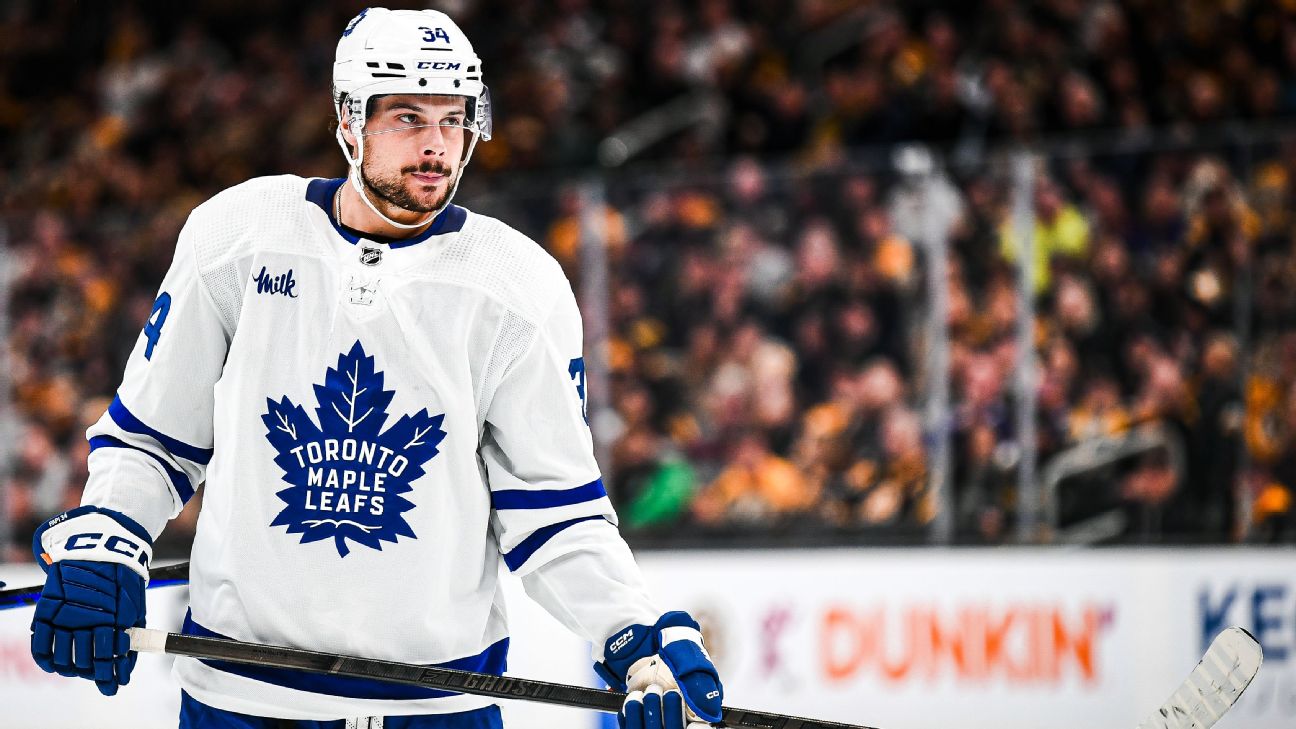
- China Wong/NHLI via Getty Images
How series against Bruins could be Auston Matthews' moment
He's one of the sport's superstars and led the NHL in goals this season. A series win against Toronto's tormentors would elevate him further.
- Runway 4 for ESPN
Inside Corey Seager's battle for the perfect MLB swing
Seager's left-handed swing is a thing of beauty. But the constant feeling that it could desert him is what turned him into MLB's new Mr. Clutch.


Get a custom ESPN experience
Enjoy the benefits of a personalized account
Select your favorite leagues, teams and players and get the latest scores, news and updates that matter most to you.